| |
Replace or maintain?
30 May 2014 • Ype Wijnia
policy development, planning
If you believe the figures, the first quarter of 2014 was the worst since 1969 as sales of cars is concerned[1]. Now that is of course very annoying when you earn your living by selling cars, but as a simple consumer I honestly care less. Then you'll have to learn a another trade. Yet the message intrigued me, because it was just another bad news from the sector. To be precise, the bad news already dated back to 2008 when the credit crunch broke out in full force. Or maybe even back to 2001, when in the wake of hijacking the global economy got a dip. Wasn’t that the year of the dotcom crisis? Or did that happen before? The point is, with so many years of bad news, you would expect that the industry is now dying. Moreover, when there are so few cars sold (we are talking of 1969, when the West still was so medieval we put men on the moon) then you would expect that the roads are littered with decaying carcasses of cars which had broken down. But nothing like that. Of course, car companies went bankrupt, but in general you do not really need to do your best to find a car dealer. The quality of the car fleet seems not have decreased significantly. In my experience, there are hardly any cars along the side of the road and those which are, do not seem to be specifically old cars. You also do not see more cars with rust spots or dents driving around. How is it possible that bad news comes out of that corner for years?
Broadly, here are two explanations for this. The first is that the bad news is simply not true, maybe not in the literal sense, but in its meaning. A sales which for example is fairly constant over the years, only needs a small dip to provide itself an exception. If you look at the car sales, to some extent it seems that this is the case. The chart below shows the Dutch care sales since 1983 (numbers per annum).
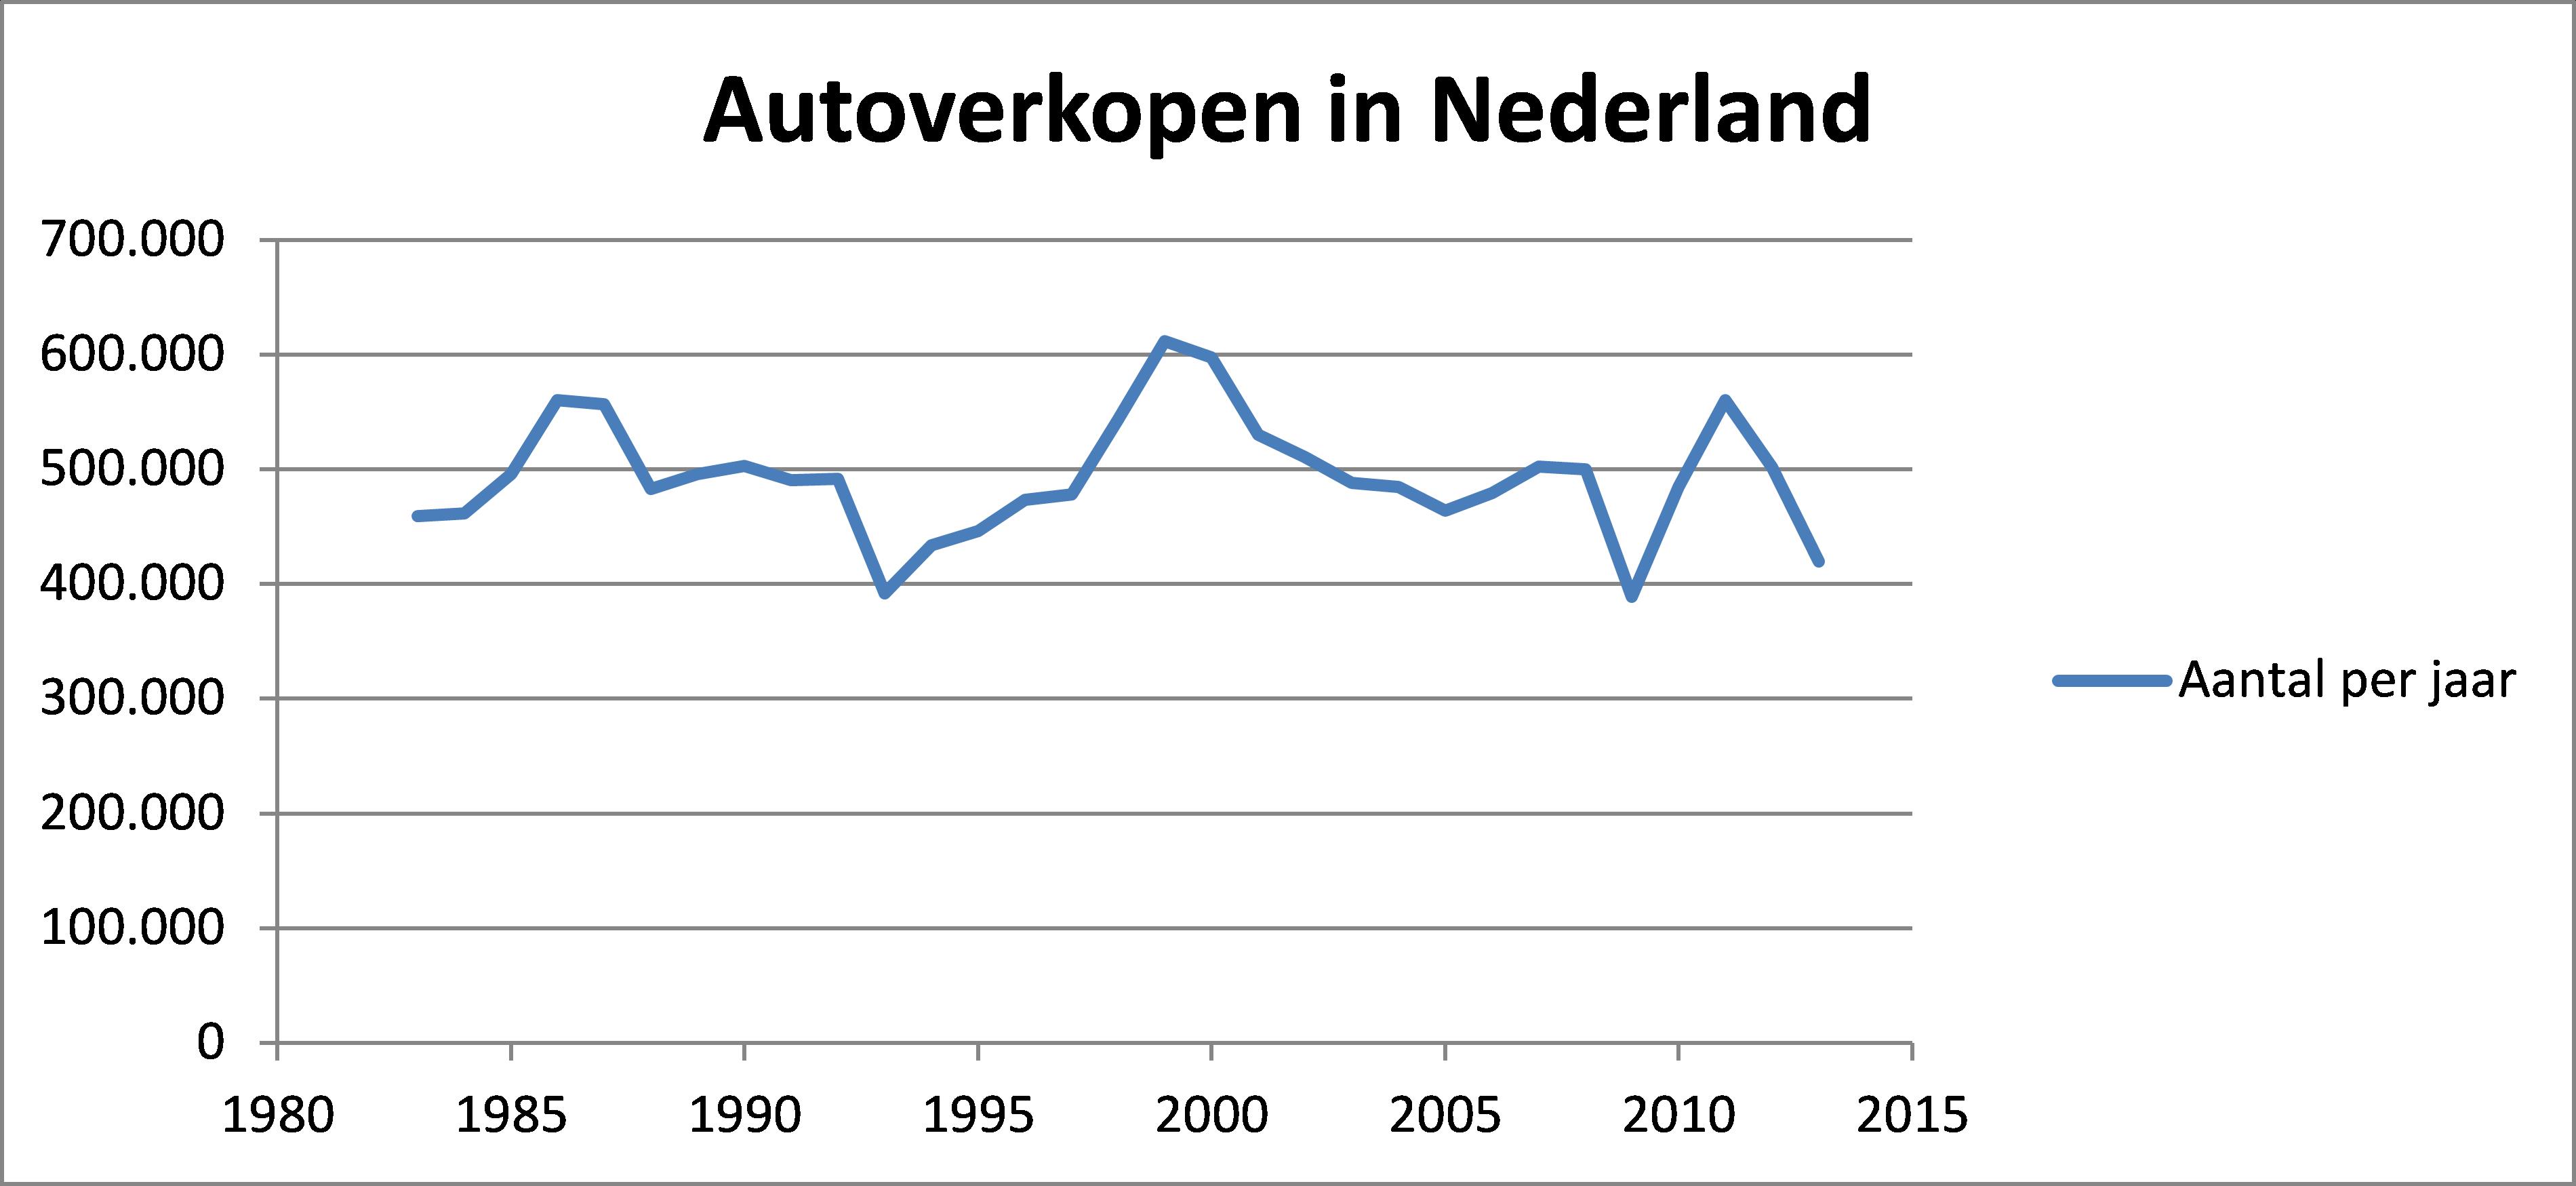
Although the signal obviously is not a straight line, in my view it still is fairly constant. To sum it up in numbers: there are 500.000 cars sold, with a standard deviation of 50.000 cars each year. In a normal distribution you would then cover about 95% of the values with 2 times the standard deviation. This seems to be the case, the extremes are slightly above 600.000 and slightly below 400.000, or a plus and a minus of 100.000 cars. Just for the record, this is a signal with a standard variation of 10%. For most asset managers this will be much less than the uncertainties with which they normally calculate.
The second explanation has to do with the state of the fleet. The assumption was that lower sales would lead to an increase in the average age of the fleet, and as a result also the number of failures would increase. Now it's time for some perspective. In total, more than 8 million cars drive around in the Netherlands, so if once upon a time a 100,000 cars are sold more or less, this will not immediately be visible in the average age. That means that there can be no major effect on the failures. Only when during a long period less cars are sold below the average, this effect will be visible, if it is already there.
To be clear, and we cannot repeat this enough, the relationship between failure rate and age of the asset is not as straightforward as one sometimes thinks. Individual components wear out, think of tires, brakes, exhaust, oil, gaskets and the like. But for a complex asset like a car you can replace any part that breaks down. Some parts may be very expensive (for example, a completely new engine) but it can be done. You can also have the misfortune of many things breaking down at the same time, so the repair is more expensive than a complete replacement. Some people then think that the car is totaled. But here we really have to step over our reptilian brains and start to thinks as an asset manager. It's not about whether the repairs will cost more than the car is worth, but how much the cost per unit usage you get in return. Suppose you buy a car for 1.500 and it should be repaired at 3.000 euros, then is it wise? Under the assumption that after repairs the car lasts undisturbed for one year and a similar new car costs 30.000 euros, that is, how crazy it might feel, yet the case. Because for those 3.000 euros you can drive a year (with some margin for unforeseen events), while due to depreciation a new will cost in the first year at least 20% (= 6.000 Euros). For this money you can conduct some repairs. New is not always better.
Speaking about the fallacies in dealing with cars, some people think that you can save money by buying a new car. Regarding maintenance this is rarely the case, as we have just shown. But if you look at the fuel consumption, or other costs, new is almost always more expensive. An inefficient car uses about one liter of fuel every 10 kilometers, an economical one covers 20 kilometers with one liter. At a fuel price of around 2 euros per liter this comes down to 20 cents or 10 cents per kilometer. But with an average of 15.000 kilometers per year, this is still only 3.000 euros for inefficient cars and 1.500 euros for the frugal. For the difference of 1.500 euros you can not buy a new car.
If you take it all together, it is actually good news that fewer new cars are sold. For consumers, because they save money. And for the asset managers because people might get a little more understanding for the continued use of old stuff. Actually there remains only one question. Where did I leave the leaflet of the dealer again?
Ype Wijnia is partner at AssetResolutions BV, a company he co-founded with John de Croon. In turn, they give their vision on an aspect of asset management in a biweekly column. The columns are published on the website of AssetResolutions, http://www.assetresolutions.nl/en/column
<< back to overview
|