Nonsense and sense of climate change
6 April 2018 • Ype Wijnia and John de Croon
risk management
Good news for all people who doubted global warming. It does not appear to be there, on the contrary: the earth is cooling down. The climate skeptics were therefore right. You do not believe it? Then you were probably brainwashed by the environmental mafia. But in this column we will show conclusively how it is.
We start nearby. The graph below shows the temperature trend in De Bilt in the Netherlands on 1 April 2018[1]. The temperature has clearly dropped from almost 10° C to almost 0 °C. If this continues, there will be a new ice age with an Elfstedentocht (Dutch skate trip of 200 km in one day) every year. Of course, this can be a coincidence.

That is why we have extended the measurement series in a number of steps. Next you can see the course of the temperature in a random week in February. The decline was even stronger there, namely from plus 4° C to less than minus 8° C.

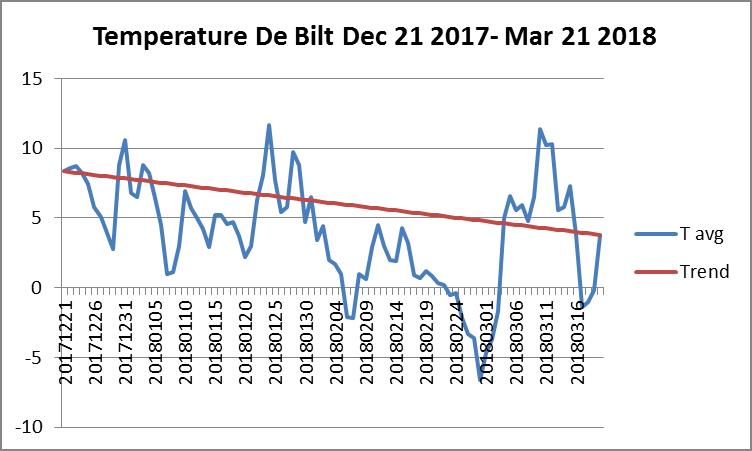
The same trend is visible in the course over a complete quarter. On 21 December it was pleasant in the beginning of winter with a temperature of almost plus 10° C. On March 21, the beginning of spring, it was only slightly above zero. Here, too, the trend is clearly decreasing, as is clearly visible in the graph.
Still not convinced? Then look at the period 2006-2016: here too a clear downward trend is visible. And that has been proven for the past 50 years, the temperature has been falling for five decades in a row. That is why we have made this chart extra large so that you can check it without reading glasses. Need we say more?

Without craziness, this is of course nonsense. The climate is very different from the weather. Climate is measured in 30 years, so a series of 10 years that has a different trend is no more than normal. In the longer term, this will be offset by a period in which the trend intensified. This can also be seen in the last graph. Despite the fact that the decades almost fit together, in 2016 it is significantly warmer than in 1950. Yet it is often used by climate deniers to show that nothing is changing. This is beautifully portrayed in the documentary with the same name of BNNVARA[2]. Now it is possible that we also have a CO2 minded spirit by the lies of the conspiring climatologists, but with that mentioned look in the kitchen of the antipropaganda, it is still cold to our hearts. And this does not even appear to be the worst. There are people walking around who even question the whole physics, up to the formula for kinetic energy[3]. For the sake of clarity, these are people who with peace of mind step into a plane which is calculated using the same "fraudulent" scientific formulas. So it is the same kind of cherry picking as we did with the trend lines in the weather data. You accept what suits you, but reject that which does not suit you. We wish we could do that with our bank account. Money that comes in is true, but money that is written off is a myth, you should actually divide that by 10.
Yet the climate deniers have a point. The precise mechanism of global warming due to additional greenhouse gases in the atmosphere is extremely complicated. The basics of physics seem fairly simple. The earth is a black beam that receives energy from the sun in the form of visible light from the one side, and it radiates all around in the form of infrared radiation according to the law of Stefan-Boltzman[4]. The equilibrium temperature is the one where the radiation is exactly the same as the irradiation. This would be around -18° C for the earth without an atmosphere. By applying an insulating blanket around the earth (the atmosphere) the radiation is less efficient and the earth must therefore become a higher temperature to be in balance again. The earth is therefore now plus 15° C. The calculations can also be applied to the neighboring planets Mars and Venus with strongly deviating atmospheres, and the models also apply there. But because the earth is a dynamic system with possible feedbacks (for example water vapor and cloud formation) and forward couplings (melting snow), the effects of a small change in the CO2 concentration are much more difficult to predict, especially with regard to the course of the temperature to the new state of equilibrium. A nice summary of the complexities can be found on the historical website of the American Institute of Physics[5]. It means that you always have to pay close attention to whether what you think you actually see is real. We illustrate this with another graph of the average daily temperature. Below is the one that can be seen for De Bilt from 1901.

The first impression is perhaps that this is a constant signal, with a variation between roughly -15° C and plus 25° C. A trend is not immediately recognizable. It seems a bit warmer recently, but that increase is much less than the variation within and between years. So that can very well be a coincidental effect. But if you look instead at the temperature to the cold and heat records, then there is a different picture. If the graph above was the result of the same unchanged stochastic source, you would expect cold and heat records to decrease to the same extent. In the first year, each measurement was a day record. That was not because it was such extreme weather (although there are people who will call it that way), but simply because it had not been measured before. But the longer you measure, the less likely you are to measure an extreme one day. See also a previous column[6]. Only if you have a rising or falling trend, the chance of a heat record will develop differently than a cold record. And that is exactly what you see in the measurements. The number of heat records has remained fairly constant over the past few years, while almost no cold records are achieved.

This shift of extremes means that the stochastic is changing in character and the whole probability curve is shifting. More convincing evidence of climate change is almost impossible to give, as the KNMI reported last January[7]. Of course this is also a concoction of the environmental mafia[8]. But for the moment we leave the skates in the fat to avoid them corroding. We will fulfill the Elfstedentocht with a solar boat[9]
John de Croon and Ype Wijnia are partner at AssetResolutions BV, a company they co-founded. Periodically they give their vision on an aspect of asset management in a column. The columns are published on the website of AssetResolutions, http://www.assetresolutions.nl/en/column
[1] Measurement data for all graphs of the KNMI, Royal Netherlands Meteorological Institute, via https://www.knmi.nl/nederland-nu/klimatologie-metingen-en-waarnemingen
[2] For example see the BNNVARA documentary “climate deniers”(in Dutch), https://www.npo.nl/2doc/10-10-2016/VARA_101381267
[3] Read and shudder on the site of Gary Nowak, http://nov79.com/index.html. The story may look impressive, but it is really complete nonsense
[4], https://nl.wikipedia.org/wiki/Constante_van_Stefan-Boltzmann, https://nl.wikipedia.org/wiki/Zwarte_straler#Formules_voor_de_totale_straling_over_het_hele_spectrum (in Dutch)
[5] American Institute of Physics, https://www.aip.org, discovery of Global Warming via http://history.aip.org/climate/index.htm
[6] http://www.assetresolutions.nl/en/column/about-the-weather
[7] https://www.knmi.nl/over-het-knmi/nieuws/temperatuurrecords-tonen-opwarming-nederland
[8] https://nieuws.weeronline.nl/25-1-2018-acht-warmterecords-versus-een-kouderecord/, see the comments below for the deniers (in Dutch)
[9] http://www.nkzonnebootrace.nl/nk-zonnebootrace-2018/
<< back to overview
|