| |
Optimal timing
10 February 2012 • Ype Wijnia
policy development, planning
The golden rule within asset management is to let the asset determine what work should be done. That means that you should try to establish what the asset needs to perform its function, and do nothing more. This ideal was (and in many cases still is) often contrasted with the old way of thinking in which the main task of management was to distribute the available resources over the activities. It is not entirely unimaginable that in those circumstances activities were invented to keep the employees busy. Such an image of the existing system as being old-fashioned and out of date is of course a perfect form of communication. If you want to get people to move you should not bore them with a nuanced scientific colloquium but inspire them with a simple story instead. The only question one might (or must?) ask is whether the story that is told is right. To phrase this differently, is the story leaving out details or is an irrelevant detail blown up to become the whole story? To be honest, with regard to the golden rule in asset management I do not know the answer.
On the one hand there is the fact that toying with assets can break them. Every engineer has had the experience of a leftover part after reassembling an equipment, or the other way around, missing a tool that apparently became part of the equipment. Or think about the dirt, scratches, bumps and so on that can result from working on the asset. These are compelling reasons to stay clear of assets as much as possible.
But on the other side, in designing measures one should balance the costs and the benefits of the measure. And I think there are very few activities that only have negative effects. They probably exist, but I imagine they would be classified as sabotage or terrorism. Even maintenance induced failures are acceptable if they overall prevent more mayhem than they cost. Furthermore, in optimizing measures the question often is not yes or no, but when. The typical example is the replacement problem for assets. Even though the existence of the bathtub curve is sometimes challenged[1], it is a known fact that physical and chemical processes like drying out, solidifying, corrosion, fatigue, wear and tear and many more do decrease the safety margins of the asset and the probability of failure of the asset increases. The precise development of the failure rate is often unknown, but reasonable limits can be established. The one extreme of assets failing at a precise moment is very unlikely, as it presumes the assets to know how to tell the time. But due to the wear and tear the asset life expectancy cannot be unlimited, in the end they will fail. Somewhere in between those extremes is a model in which an asset dies out over a certain period. The age at which hardly any (say less than 1%) of the assets has failed could be regarded as the failure free period, and the age which most assets do not make (again say less than 1% gets older) the maximum age. Such a failure behavior is quite easy to approach with a continuously growing failure rate, with a relative increase of the failure probability from year to year by typically 5-20%[2]. If the growth rate is very high this resembles failing at a fixed age, if the growth rate is very low this suggest an unlimited age potential.
If this development of the risk (under the assumption of failure consequences being independent of the age) is plotted in a graph, combined with the annual equivalent costs of replacing the asset in a certain cycle a typical optimization curve results, as demonstrated below.
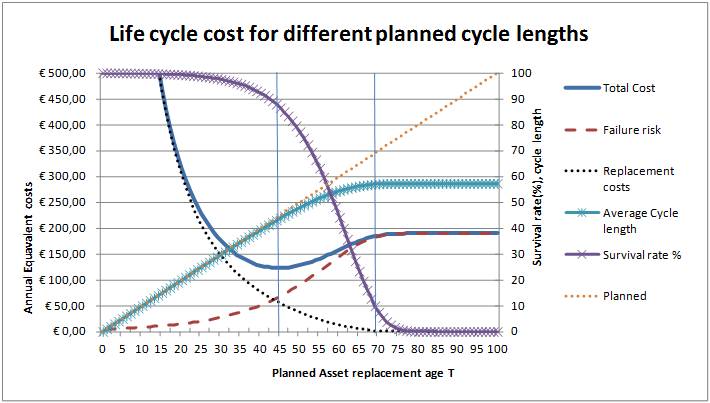
The purple line (with the crosses) represents the survival rate of the asset. Out of the population of assets in this example about 90% would at least reach the age of 45, and only 10% reaches an age of 70 years. The black dotted line represents the annual equivalent costs of the planned replacement cycle. For short cycles this cost is very high (even outside the graph), but for longer cycles it approaches zero.One can plan to replace an asset at the age of 90, but if none of the population gets that old there will be no planned replacement costs, only corrective replacements. These are part of the red dashed line, the failure risk. For this curve the movement is reversed. At very short cycles there is almost no risk, but with increasing cycles the risk also increases. However, above a certain age a new level is reached. At this point the replacement strategy has become fully corrective, and postponing the replacement does not have any effect as the asset has died out. Combining failure risk with the replacement cost gives the total cost of ownership, represented by the solid blue line. This curve has a minimum around 45 years. The other lines in the graph represent the planned age (red dotted line) and the average realized replacement (both planned and unplanned) age, represented by the blue crossed line. These show that a planned replacement age of 45 years is achievable (lines overlap), but a fully corrective strategy would result in an average cycle of slightly less than 60 years.
If the golden rule of asset management is followed in those kind of optimizations the asset replacement should be planned at precisely 45 years, as the TCO would then be minimal. However, at closer inspection the curve reveals that the TCO does not vary much around this optimal age. Shifting the timing with 5 years is hardly visible, and even shifting the replacement by 10 years in any direction still only gives a difference in TCO of about 10%. This means that if factors are at play which could increase the costs by about 10%, the optimum could shift by ten years! This kind of price fluctuations is not out of the ordinary that can be expected for the labor market. In times of strong economic development labor will become more expensive, and it might be wise to postpone the replacement. But if the economy is in a recession and labor becomes cheap, it might be attractive to replace the asset early. But that is very close to allocating resources to the potential activities, the old fashioned way of thinking. Apparently it is not all that glitters that is gold.
Ype Wijnia is partner at AssetResolutions BV, a company he co-founded with John de Croon. In turn, they give their vision on an aspect of asset management in a weekly column. The columns are published on the website of AssetResolutions, http://www.assetresolutions.nl/en/column
[1] To be precise, in a study of Nowlan, Stanley en Heap (1978) it was found that only 6% of assets has a wear out zone (the end of the bathtub), but the research was on composed systems. Part virtually always wear out, but the vast majority of systems does not as the parts can be replaced. Only if critical parts cannot be replaced economically the system copies the failure behavior of the part.
[2] The mathematical formulation can be found in my work on long term optimization of asset replacement.
<< back to overview
|